Destatis, the official German statistics authority, has again been criticized. The core accusation is that the authority has been misleading the public about mortality trends. The existence of methodological errors is beyond doubt, but the extent of the errors is unclear. I will present some findings here in addition to an earlier article.
In principle, this business is about hypothesis testing. A decision has to be made as to whether the mortality risk deviates from an expected value over a period of time. Uncertainties exist in particular in the determination of the expected values.
Destatis proceeds as follows. As an estimate of deaths to be expected for each calendar week (CW), the median of deaths is calculated from the same CWs of the 4 previous years. This estimate is compared with the actual number of deaths. This method was introduced in July 2021. Until then, the arithmetic mean was used as expected value.
Three sources of error can be identified. Firstly, German society is constantly ageing, meaning that more deaths are to be expected. Since Destatis does not process any information about the population structure, the expected values are estimated too low. Secondly, the statistical distribution of deaths is asymmetrical. In the median out of 4 method, a value slightly below the middle and a value far above the middle are therefore often removed from the calculation. The expected values are then lower than the arithmetic mean. These two effects yield a chronic, fictitious excess mortality. Thirdly, there are long-term trends towards lower mortality risks and increasing life expectancy in numerous age cohorts, and it is an implausible hypothesis that these trends would suddenly stop without external impact. Since Destatis also ignores this, the expected values are set somewhat too high.
To obtain the error due to the ongoing population structure, I multiplied the cohort mortality risks of the past years by the cohort population differences which accumulated during these years. The result are total death figures for each year. An influence due to population is proven, if differences occur in these death figures. They do as shown in Fig. 1.
Fig. 1: Errors of death figure prediction due to neglecting the population.
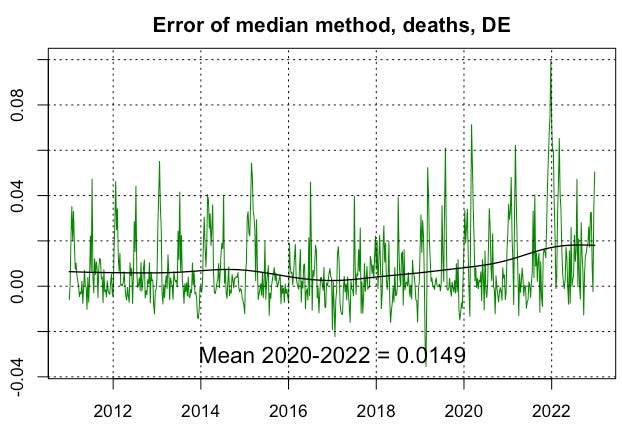
I then determined and compared two expected values. One with the median method and one with the mean method, both applied to the raw death figures of 4 previous years. This leads to weekly aberrations as plotted in Fig. 2. An upward trend can be observed here, which will continue for a couple of years as a result of the society ageing. If a population contains more old people, the positive swings increase but the median score swallows them up meanwhile the mean method does not.
Fig. 2: Weekly errors of death figure prediction due to the median method minus mean method. The black line shows a gaussian kernel smooth of the signal.
The long-term risk trends must be determined individually for each age cohort because they differ. I computed them from Destatis' "Sonderauswertung Sterbefälle" in 14 given age cohorts and from a weekly interpolation of the cohort populations. The actuarial lege artis method here is the exponential fit. These fit functions are sampled at the beginning of each year, multiplied by the average population between two samples and added up. This results to the yearly change in total death figures caused by the risk trends (Fig. 3).
Fig. 3: Error due to long-term trend in death risks
Now we can estimate the mean total error for the years 2020-2022 as
0.0155 + 0.0149 - 0.0054 = 0.0250 = 2.50% p. a.
Because Destatis evaluates 4 previous years, the reference period is 2.5 years ago on average, so we have to admit 2.5 as much, i.e. 6.25%. With around 1 million annual deaths, this creates an error of 62,500 deaths p. a. It's like a massive flu wave hitting every year.
From a political point of view, the timing of the introduction of the median method is interesting. In July 2021, mass vaccinations in Germany were in full swing, but at the same time there was a controversy about the actual danger of C19, especially among those who had hesitated to be vaccinated until then. There was an urgent need to make 2020 not look too good. To this day, Destatis does not accurately reflect the German death rates in 2020. The press release speaks of normal mortality and temporarily increased mortality due to C19. In fact, life expectancy reached outstandingly good values during the months of Jan-Nov 2020. Even with the inclusion of Dec, 2020 achieved the second-best figure of all time. Destatis completely obscures this fact. In the official life tables they summarize 3 years into one value. The accusation of statistical deception seems all the more spicy since there was a motive.


Bei Destatis wurde schon vor der Corona-Krise ein Klima der Angst geschaffen. Die Arbeit wurde durch dauernde Reorganisationen erschwert. Es wurde ein Behördenchef eingesetzt, der mit dem zweifelhaften Ruf angetreten ist, in seiner vorherigen Stellung einen Mitarbeiter in den Selbstmord getrieben zu haben. Damals konnte ich das noch nicht einordnen. Aber wenn wir von einer "Plandemie" sprechen, war das evtl. schon ein Teil des Plans oder doch nur Zufall und eine Verschwörungstheorie 🤔
https://m.focus.de/kultur/gesellschaft/mitarbeiter-schlagen-alarm-mobbing-druck-angst-schwere-vorwuerfe-gegen-chef-des-statistischen-bundesamts_id_13317751.html
Siehe auch https://multipolar-magazin.de/artikel/destatis-uebersterblichkeit