Statistics Sweden provides excellent demographic data, and right quick. Already in February 2023, an annual evaluation for 2022 announced the lowest birth numbers in 17 years (-8.3%). I have examined their data, in order to uncover results that may also be valid for other countries.
Meanwhile, data for January and February 2023 are also available, which do not show an improvement (-10.7% and -9.2%).
From 2018 to 2021, Sweden's births followed a seasonal periodicity and showed a weak negative trend. I applied a curve fit over this time period and generated a forecast for 2022 and 2023 therefrom (Fig. 1).
Fig. 1: Monthly births in Sweden with fit (Time Series Linear Model, light blue), forecast (blue) and 95% CI (light blue).
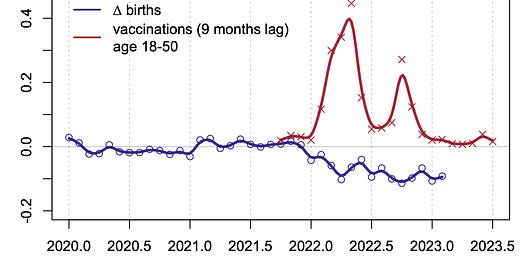
The actual values deviated slightly from the fit during this period. But since January 2022, they have run below the 95% confidence interval of the prediction, indicating a statistical significance. The differences show a temporal relationship with the Swedish C19 vaccination campaign (Fig. 2).
Fig. 2: Temporal relationship of birth decline and C19 vaccination coverage of the reproductive age group. Vaccinations are given in jabs / (population * month), source: ECDC vaccination data.
Taking into account a 9-month time shift, it can be seen that the two events started almost simultaneously. For the period October 2021 to December 2022, a statistically significant negative rank correlation can be demonstrated (Spearman's 𝜌 = -0.53, p = 0.021). However, when the 2023 birth numbers are added, this no longer holds, which could be an indication of longer-lasting effects.
A test for Granger causality in the above time window does not lead to a result. For the cause "vaccination" a p = 0.90, and for the cause "decline in births" p = 0.55 is calculated. Thus, Granger causality is unlikely to be given from this data. The results do not improve also when the curves of individual doses are evaluated. This could be due to insufficient temporal resolution. Furthermore, both signals include the overlap of multiple vaccination series, which cannot be studied separately due to lack of data availability.
Apart from these statistical studies, there are considerable biomedical reasons for linking C19 vaccination and fertility reduction, and it remains unclear how long the fertility reduction will last and in what proportion it is distributed between males and females.
The latest Swedish data suggest that fertility impairment persists for at least two months after the end of mass vaccination.


Thank you...
I've added your data to the growing list of infertility and birth rate anomolies
https://totalityofevidence.com/menstrual-irregularities-infertility-and-the-shots/
Great figures!
In addition, I would like to see how new marriages (as bad proxy for attempts at creating children) would fit into fig. 2:
https://www.statistikdatabasen.scb.se/pxweb/en/ssd/START__BE__BE0101__BE0101L/ManadGiftSkilsm/