Recently, I demonstrated a spurious correlation between vaccination rates and mortality in German substates. The same phenomenon can be shown for European countries. Raimund Hagemann aka "Real DataHero" collected a data set, which he kindly made available to me for this purpose.
The data includes the decline in life expectancy late 2021, vaccination rates and some epidemiological influencing factors, namely alcohol consumption (liters per person-year), smoking rate and gross domestic product GDP. To show the essentials, I look at people under the age of 60. Older people differ only slightly in the results.
At first glance, the correlation between vaccination rates and loss of lifetime seems impressive (Fig. 1).
Fig. 1: Correlation of vaccination rate and lifetime loss in European countries.
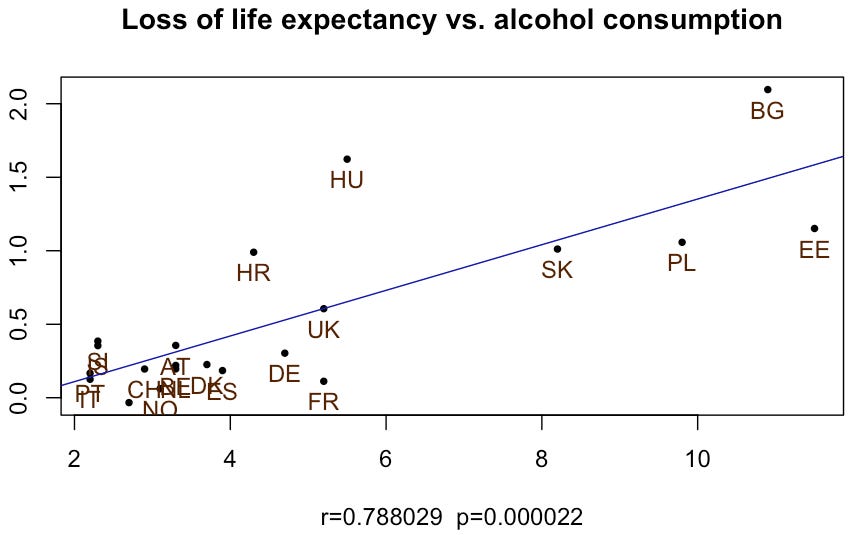
However, we also find correlations with the other influencing parameters mentioned. These are not significant in all cases, but especially the influence of alcohol consumption is clearer than the vaccination rates. The correlation value r is higher and more significant (lower p-value) (Fig. 2).
Fig. 2: Correlation of alcohol consumption and lifetime loss in European countries.
The existence of co-factors has thus already been proven. If all three confounders are taken into account when determining the partial correlation between lifetime loss and vaccination quote, the value r = -0.76 ( p = 0.000073 ) weakens to r = -0.48 ( p = 0.046 ). This is almost no longer significant, and we must be aware that countless other possible influences on health have not yet been taken into account.
But there's another thing. The geographically trained eye notices that the differences originate from a group of eastern countries that were formerly part of the Warsaw Pact. I filtered them out and plotted the first diagram again (Fig. 3).
Fig. 3: Correlation of vaccination rate and lifetime loss in European countries except former Warsaw Pact countries.
The correlation has now disappeared in these western countries. Almost a flat line and a large p-value. This is what noise looks like. The inclusion of the confounders leads to a weak positive partial correlation r = 0.11, which is not significant, too (p = 0.74).
It can therefore be shown both within Germany and within Europe that the consideration of a few confounders as well as geographical and historical differences refutes the originally claimed correlation.
Has anyone ever claimed that? - Yes, Schöley et. al. in Life expectancy changes since COVID-19.
Excerpt from the abstract:
Life expectancy deficits during fall/winter 2021 among people ages 60+ and <60 were negatively correlated with measures of vaccination uptake across countries (r60+ = −0.86; two-tailed P < 0.001; 95% confidence interval, −0.94 to −0.69; r<60 = −0.74; two-tailed P < 0.001; 95% confidence interval, −0.88 to −0.46).
Since geographical differences do not seem to matter to these gentlemen, they have not shied away from mixing the USA and Chile with the otherwise European data. What kind of magazines print these things? - Nature Human Behaviour.


Excellen again, thank you very much!
However, I disagree in
"( p = 0.046 ). This is almost no longer significant,"
We should such p-values in retrospective and purely observational setting not call significant unless the p-value is <0.005. Even then, as the example above tells us, we should remain careful even with p-values as low as 0.00007 (as shown above).
On the "fun" page of my births Excel sheet, I list country name (how about rank by lexicographical order), capital (same), population of capital, population of country, area, and distance between capital and Moscow...
https://cm27874.substack.com/p/european-births-q2-2023-update