Figures about ICD main diagnoses at hospital admission are yearly provided by the Swiss statistical office BMF. The data set includes about 1.4 million cases p. a. separated in about 9,000 ICD codes. We have to be aware of some limitations concerning the interpretation of these figures. The data can only reflect a subset of the illnesses because secondary diagnoses are missing as well as outpatient medical treatments. We must also note that individual ICD codes can lead to misinterpretations because a particular clinical picture can be represented in numerous different codes, but a main diagnosis, per definitionem, is unique. If we want to draw results from this data, the challenge consists in an intelligent pattern matching in combination with the knowledge of medical connections. Although I'm sure that I have not yet found all important aspects, I would like to present some findings so far in this article.
General figures
Two anomalies can be seen in the overall figures (Fig. 1). First, a nadir in 2020 (1.37 million p.a.) and a max level in 2022 (1.46 million p.a.).
Fig. 1: Yearly number of hospital main diagnoses in Switzerland, 2016-2022. The red line marks 2020.
I have to smile twice. This very simple diagram made of just added up cases shatters the edifice of lies about hospitals being overwhelmed in 2020, which has provided the legal justification for all sorts of harmful measures against whatever. Furthermore, things don't seem to have changed for the better in 2022 - in spite of or because of the interventions against whatever?
Mental and behavioral disorders
If we put aside physical suffering for a moment, the mental illnesses remain, which are marked with the letter "F" in the ICD classification. The aggregated data result in the course shown in Fig. 2.
Fig. 2: Letter “F”, Mental and behavioral disorders.
The group of mental disorders has seen a steeper increase in 2021 and 2022 than before. Due to the relatively high number of cases, approximately 100,000 per year, this group represents a significant burden on the healthcare system. Representing some others, I would like to show some forms of autism here, which predominantly affect young children and is constantly on the rise, thus receiving public attention. The increase has accelerated in 2022, and please remember that these figures show hospitalizations, so in this case they probably represent only the tip of the iceberg (Fig. 3).
Fig. 3: ICD F84[01], Autism.
Asperger syndrome, a similar kind of mental disorder, was rising also, but the biggest step appeared in 2020 already. (Fig. 4).
Fig. 4: ICD F845, Asperger syndrome
In contrast to the previous, Rett syndrome decreased (Fig. 5). However, the numbers here were low.
Fig. 5: ICD F842, Rett syndrome.
Rett syndrome is a special case, because the etiology has been proven. It is a hereditary disease in which a mutation occurs during cell division. So we can say that there is no increase where the cause is known, and vice versa. I'm not sure how to interpret that.
Myocarditis, pericarditis, endocarditis
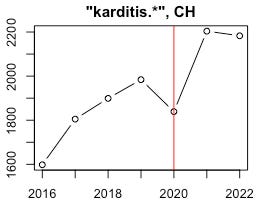
Inflammation of the heart muscle and its surrounding tissues (mycocarditis, endocarditis, pericarditis) was an early detected side effect of C19 vaccines. The Swiss hospital figures prove that these heart diseases are by no means mild and temporary, as vaccination advocates have claimed without solid evidence. No, they led to additional hospital stays. 2021 as well as 2022 were significantly higher than in previous years (Fig. 6).
Fig. 6: Results from GREP query “karditis”, Inflammation of heart tissue.
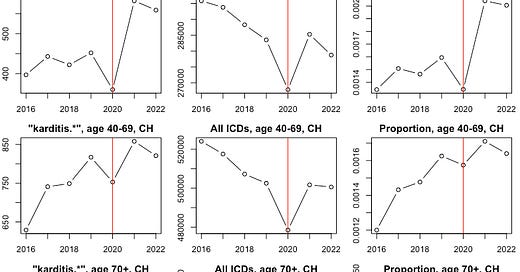
The highest jump in 2021 probably not happened without cause. Nevertheless, it should not be forgotten that there is an overall positive trend. Furthermore, it has been reported that this side effect particularly affects young people. I thought about methods to resolve this age and trend relationship more precisely and came up with this: put the annual number of cases of heart inflammation in relation to the annual number of total treatments, separately for each given age group. In short, this figure means what proportion heart inflammation made up in relation to the total cases in each year. In this way, shifts in population sizes are indirectly compensated and figures similar to the risk ratio can be derived. The influence of age becomes clearly visible (Fig. 7).
Fig. 7: Inflammation of heart tissue in different age cohorts. Left: raw number, middle: all diagnoses in specified age group, right: proportion.
From the right column, the mean of 2021-2022 in relation to the mean of 2016-2020 is computed:
 age group   ratio of proportions    increase
----------------------------------------------
      0-14                   1.63         63%

     15-39                   1.39         39%

     40-59                   1.15         15%

       70+                   1.08          8%
The result is a steadily decreasing change in proportion ratios with age. While the 0-14 year olds experienced an increase of 63%, the increase for the 70+ year olds was only 8%. In the two oldest cohorts, the increase could also be explained by the long-term trend, if we reduce the consideration on pure mathematics. In addition, a bias is to be expected because older people often have multiple morbidities. It is inevitable then, that a higher proportion of them is hidden in the unknown secondary diagnoses.
Infarction and thrombosis
Infarction is a general term for blockages in the arteries. Obstruction of blood flow in veins is called thrombosis. After the first C19 vaccinations, it quickly became clear that many complications related to blood clotting and blood vessel inflammations occurred. Heart attacks, strokes and leg vein thrombosis are commonly known, but obstructions can also occur in other organs, such as the spleen, liver or kidneys. I will show venous and arterial cases in combination; their diagrams are similar. The yearly cases in the whole population increased over years, if regarding the raw numbers. But in the proportion relative to the entire yearly diagnoses in Swiss hospitals show a remarkable trend reversal since 2020. Again, the aggregation over all age groups is blurring certain danger signals, here particularly in the age groups 15-39 and 40-69. (Fig. 8).
Fig. 8: GREP query “(thrombo)|(infarkt)” = Any thrombosis or infarction
Cancer
The thought of a cancer diagnosis is a terrible nightmare for most people and has therefore always been a popular tool for stirring up panic. Experts in medicine, biochemistry and toxicology warned early on about various cancer risks of the new C19 vaccines and thus exposed themselves to the suspicion of wanting to cause unrest. Later, the figures on vaccine side effects in the relevant databases revealed a disproportionately high number of suspected cancer cases compared to previous vaccines. These observations were accompanied by anecdotal reports from oncologists and pathologists. I consider these aspects to be important, but encountered some difficulties in identifying a cancer increase in the overall numbers. However, this impression changes when we examine younger age cohorts, whose contribution to the overall figures is small, but multiple diagnoses are less common among younger people and diagnoses are therefore less likely to be concealed. I evaluated the entire subset of cancer in Fig. 9 using the method described above.
Fig. 9: Diagnoses “C.*”, Cancer
The raw numbers of the age cohort “Total” did not increase in 2021 and 2022, and in terms of proportion relative to all yearly diagnoses, the curve moves downwards from a peak in 2020. Quite the opposite occurs in the age cohorts “0-14” - a now well known pattern.
Non-specific general symptoms
An indirect result of the analyses so far is that there must have been massive increases in diagnoses somewhere else. There is an increase partially in very general symptoms that can occur in a variety of diseases. I show a selection of them without claiming to be complete.
Fig. 10: GREP query “fieber.*", Fever.
Fig. 11: GREP query “husten.*", Cough.
Fig. 12: GREP query “pneumonie.*", Pneumonia.
Fig. 13: GREP query “bronchiol.*", Bronchiolitis.
Fig. 14: GREP query “bronchitis.*", Bronchitis.
Fig. 15: GREP query “respiratorisch.*", diagnoses concerning the respiratory organs.
There seem to be a hedging of additional diagnoses for febrile infections, especially of the respiratory tract. The increase in pneumonia cases in 2020 is impressive. This number certainly includes a high proportion of “Covid cases”. In 2021 and 2022, the upper respiratory tract seems to have been more affected.
Diseases of the musculoskeletal system and connective tissue
This diagnosis group also provides huge numbers accompanied by a trend reversal in 2020.
Fig. 16: GREP query “M.+” = Diseases of the musculoskeletal system and connective tissue.
A very disturbing picture ist given by “Muscle wasting and atrophy, not elsewhere classified”.
Fig. 17: GREP query “M625.*”, Muscle wasting and atrophy, not elsewhere classified.
Noninflammatory disorders of female genital tract
The most common side effect of the C19 vaccines was menstrual irregularities. I didn't expect them to lead to hospitalizations in a visible extend. But they did (Fig. 18).
Fig. 18: GREP query “menstru”.
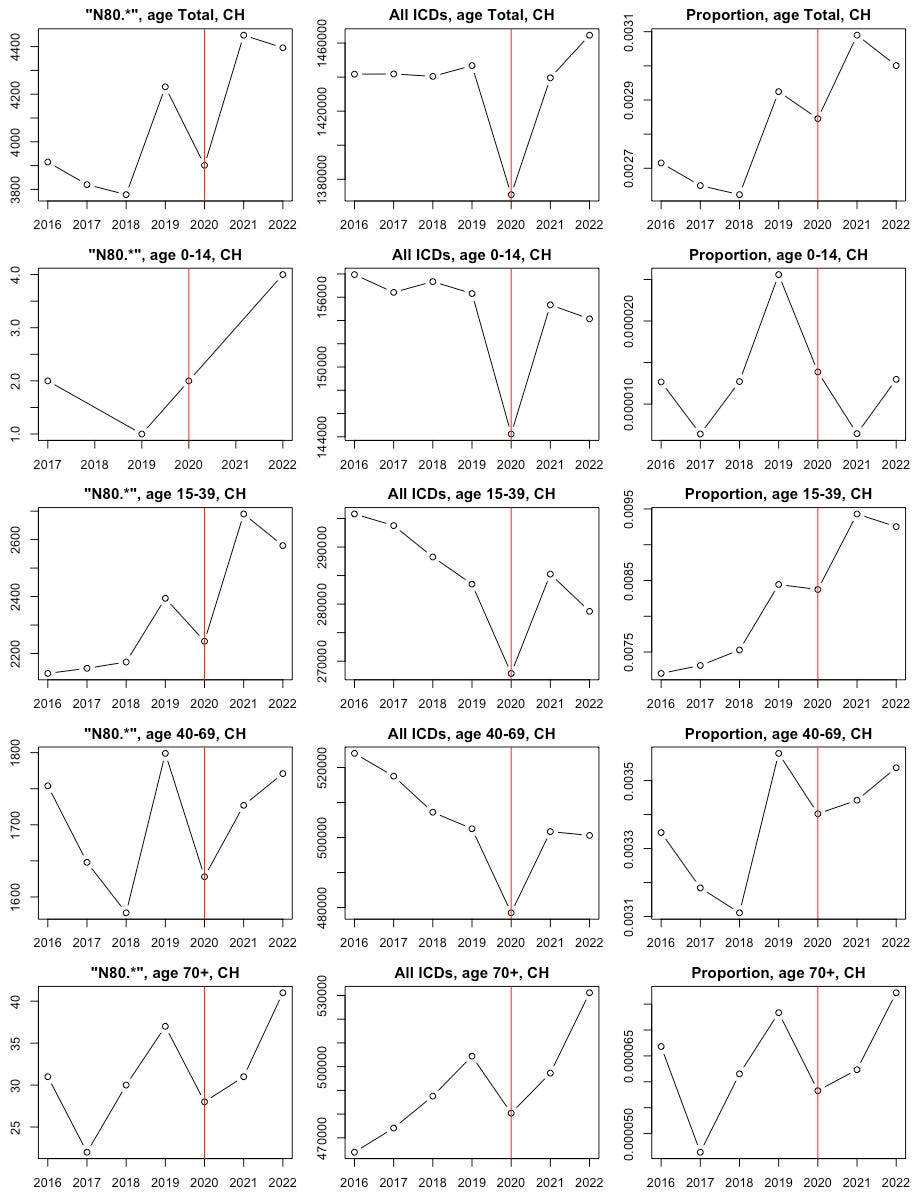
A clear trend reversal appears in the middle age cohorts. Another striking signal in this subgroup, especially because of its high numbers, is found in endometriosis. (Fig. 19).
Fig. 19: GREP query “N80.*”, Endometriosis.
That's my current overview of the Swiss hospital diagnosis data up to 2022. The figures for 2023 are expected to be available in November. If they provide new clues, I'll get back here.


Thank you very much! Excellent work!
For me the most surprising finding was the increase in C-diagnoses, i.e. malignant neoplasms, in the age class 0-14. Moreover, I did not expect so many cases in this age class, rethinking: my fault. The sheer number of cases might justify the classification: significant.